Today in class, our professor exclaimed that IIM Bangalore was responsible for about 4,500 tonnes of CO2 emissions per annum. Crazy, right?
She quoted this data point emphatically, expecting a reaction from the classroom. This reaction did not come. The classroom responded with a sheepish silence, and several sideward glances to check reactions from other potentially more informed classmates. The class was unsure of what this data meant. Was the professor expecting jubilant smiles or murmurs of dismay?
Was this supposed to be a good thing? 4,500 tonnes of CO2… hmm, a tonne is 1000kg. so 4,500 of those seem like a lot, I guess.
But nobody asked. Nobody wanted to seem less intelligent. So as usual, it was just brushed over and drowned away with a wave of coordinated nods of understanding and a barrage of perfunctory smiles.
The issue here is a lack of context. 4,500 tonnes1 means nothing without a relative understanding of the scale on which it is measured. This begs the question: How many such pieces of data do we unknowingly watch go over our heads?
Many of us in MBA/corporate circles tend to think that we’re great with numbers because we wrote some tests and solved a bunch of logical reasoning questions. This is a misguided notion. It is only when we come to the practical use of numbers in the real world that our understanding may fall short. When numbers start getting large, to millions, billions, kilotonnes & lakh crores, the true value becomes ambiguous.

This article aims to break some of those assumptions, provide a bit of context to numbers we see & hear often, and suggest techniques that I use to keep expanding my understanding of the magnitudes of this massive world we live in.
I hope you are able to use this as a manual to start think more intuitively and be quicker with logical induction.
Scale Refreshments & Fun Examples
We will look at examples of big numbers, starting from everyday items and going higher from there. As you read through, do try to guess first, and then compare your guess with the true value. I will elucidate my arguments alongside these examples.
Biology
Our own bodies are the first mathematical marvel we are exposed to. You find surprising facts in encyclopedias in school and start questioning the scale of reality.
Your body contains 60% water by weight - so in my 70kg body, 42kg (litres) of it is water. (This one is a classic.)
An average young male has 100,000 hairs on his head.
A single gram of DNA can store 200 petabytes of data. (1 petabyte = 1024TB = around 1mil GB)
There is about 150 zettabytes (10^21) of data that exists in the world. A zettabyte is 1,000,000 petabytes. So taking 200 million petabytes and calculating volume: around 750kg or 750litre (DNA has a density of around 1.)
This means that ALL the world’s data, if stored using DNA structures, can be stored in a space similar to that of a big van like an Innova Crysta!
You probably tuned all these numbers out as you read them. I sure did.
The points above were mentioned specifically to elucidate this point. We naturally tend to disregard numbers that are outside our level of comprehension. Plus, we don’t have any practical use-case of knowing how much 150 zettabytes are in our day to day lives. So our brain tunes them out.
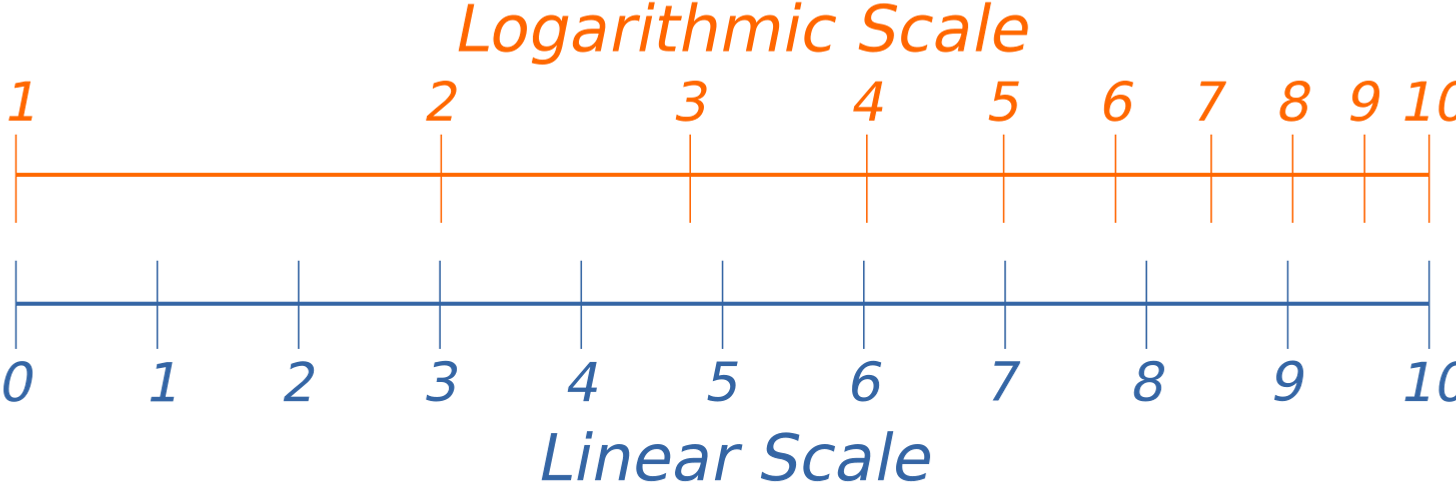
Why does this happen? Research2 shows that our mental number lines are compressed on the higher end, making larger numbers less conspicuous than the smaller ones within our understanding. Our mental ruler is not graduated evenly with marks at regular intervals as on a linear scale. Rather, it behaves like a logarithmic scale, where the similar distances are allocated between 1 and 2, 2 and 4, 4 and 8, and so on.
History
A million seconds is about 11.5 days, while a billion seconds is almost 32 years.
Evolution into the homo-sapien happened about 300,000 years ago. They left Africa about 100,000 years ago, and developed a capacity for language about 50,000 years ago. Agriculture is said to have started around 10,000 BC, and the rest, as they say, is history. So it has been 12,025 years since then, with rich and vast history - but again, our understanding is warped due to the scale we use, marking Year 1 AD using the Gregorian calendar.
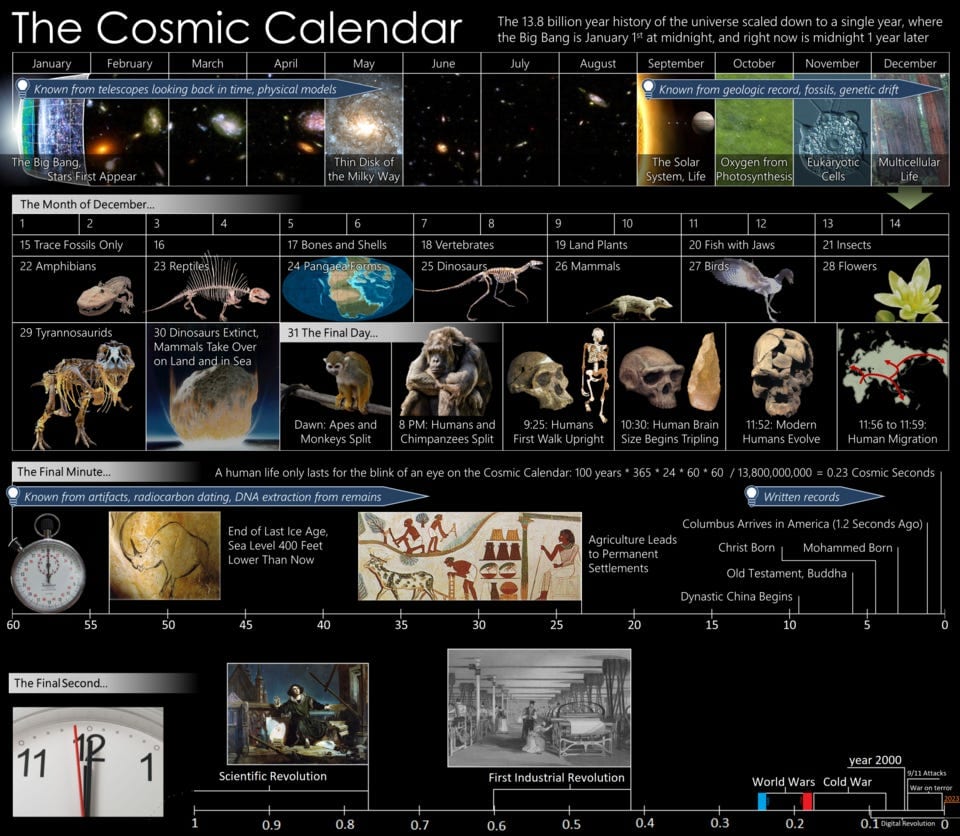
The Earth was formed 4.54 billion years ago. BILLION. This means, if we compressed the Earth’s history into 24 hours, humans showed up at around 23:59:58 hrs, 2 seconds before the end of the scale. And all of recorded human history happens in the last 0.2 seconds. The Cretaceous period ended 65 million years ago, marking the end of the dinosaurs. By this logic, dinosaurs appeared at around 23:40:00 hrs, and went extinct at 23:58:00 hrs.
This is Carl Sagan’s Cosmic Calendar, depicting the history of the universe as a calendar year.
(Also, unrelated but attached is an awesome YouTube classic you must watch by Bill Wurtz: History of the Entire World - Bill Wurtz. You will be on your way exploring history after this.)
The SCALE of the UNIVERSE is a fun website my brother and I discovered many years ago. We played around on this for hours and had many a revelations.
Have a go: https://scaleofuniverse.com/en
We talked about biology & history, and discussed why we may have gaps in our understanding of numbers, because of our brain’s logarithmic & compressed numberline.
But things like Biology & History have no direct use in our real lives. This is an important factor influencing our ability to process & recall high magnitude values. So let’s discuss things closer to ground reality.
People & Geography
Most of us learnt the following in Grade 8 Social Sciences. It’s important to refresh these things and go further.
The earth’s circumference is 40,000 kilometres.
From Kashmir to Kanyakumari, the distance is about 3,200km.
Delhi is 1500sq.km in area and Bangalore is 750sq.km.
Bangalore’s population is 1.5Crore, or 15million, while Karnataka’s population is 6.2Cr, or 62 million (2011 Census.) In going to the next step, the state level, we access the real insight: 25%, a quarter of the state of Karnataka’s population is stuffed into this city!
The state of Uttar Pradesh houses 240 million people. If it were a country, it’d be the 5th most populous country in the world!
Money
Understanding money & the flow of capital across the world is one of the most important reasons to improve our number crunching capacities.
India’s GDP is about 4.2 lakh crores USD, with Germany (4.74 LCr) , China(19.23LCr) & USA (30.5LCr) ahead of it.
Lakh crore?
This is a commonly ‘ignored’ value that is used all the time in the Indian context. Lakh-crore seems very abstract because of it’s sheer magnitude & the fact that both lakh and crore are have their own stored values that sound… pretty big.
Why do we use lakh and crore? The use of the terms "lakhs" and "crores" in the Indian subcontinent (Pak, Nepal, Bangadesh) originate from Sanskrit words लक्ष (laksha) and कोटि (koti) respectively. The Indian number system was fairly advanced, with words for higher denominations too. The commas are separated with the 3:2:2 rule.
The international number standard uses millions, billions - consistent 3 digit jumps in the order of 10^3. Lakhs & Crores in the Indian number system however are not consistently spaced. (China, Japan also have secondary systems based on groupings of 10,000, developed from their vernacular number systems, but use the international number standard for business.)
I wonder why we still use this format - perhaps because of Indian regional languages understanding crores and lakhs better. It would definitely be a lot more efficient to use the international standard of millions/billions, considering that money values are calculated on a global scale or on the USD.
As it is now, we see ‘lakh crores’ quite often at the national level.
India budgeted INR 48.20 lakh crore in expenditure outlay this financial year.3
That’s 48.20 trillion rupees, which comes out to about $580 billion USD.The US’s annual budget is about $6.5 trillion (USD).4 Much over 10 times the Indian amount.
My suggestion is to have these conversions at quick access in our heads - so that you can make quick comparisons and understand how big or small an amount really is. If we become fast at understanding these differences, we can make better comparisons - like the India/U.S comparison that many often make, while the 2 markets are vastly different.
Now that these are immediately accessible/understandable to us, we can go on to the next inference, where we can come to conclusions that matter:
The US spends more on healthcare programs & services ($1.9 trillion)5 than the entire union budget of India. Almost 4 times as much. We all know that these countries are vastly different, but we need to truly understand exactly by how much that is, in various sectors.
Let’s try a random question: How much is an Airbus A320?
100 million dollars is the approximate price of an Airbus A3206 (most airlines lease them.) I instantly know that 100million dollars is around 8.5billion rupees - then from there I know that INR 850 crores is the approximate value I’m looking for. This kind of conversion should be obvious, but I only started grasping these well a while ago. Before that, I would shoot in the dark, or quickly Google things that I needed.
You could argue that all information is immediately available just 1 step away - but I would argue that having basic heuristics to guess values, and convert them into useful units puts you a step ahead - so that now when you do look something up, you are looking for the 2nd degree question, one level deeper. You can go big, small or even right in front of you. How many litres of water do you spend each time you bathe?
Asking random questions like the question of the airplane or of the buckets of water help us build our dataset, which makes our brain’s uneven scale of the world gradually become more and more even. Random questions are great, because they help us leave our own comfort zones.
Surely, we understand numbers within our own functional contexts: If you work at an E-commerce warehouse, surely you know how many orders are placed a day in a certain area. If you work in VC, you’ll know how much money a certain firm raised and so on. But if you inculcate this practice of asking yourself random guesstimates all the time, you will learn things that give you incredible breadth, that you can use across industries. Eventually, you will be in a situation where your dataset grows large enough to start linking related values - which is when you will have your Eureka moment, and look at problems worth solving.
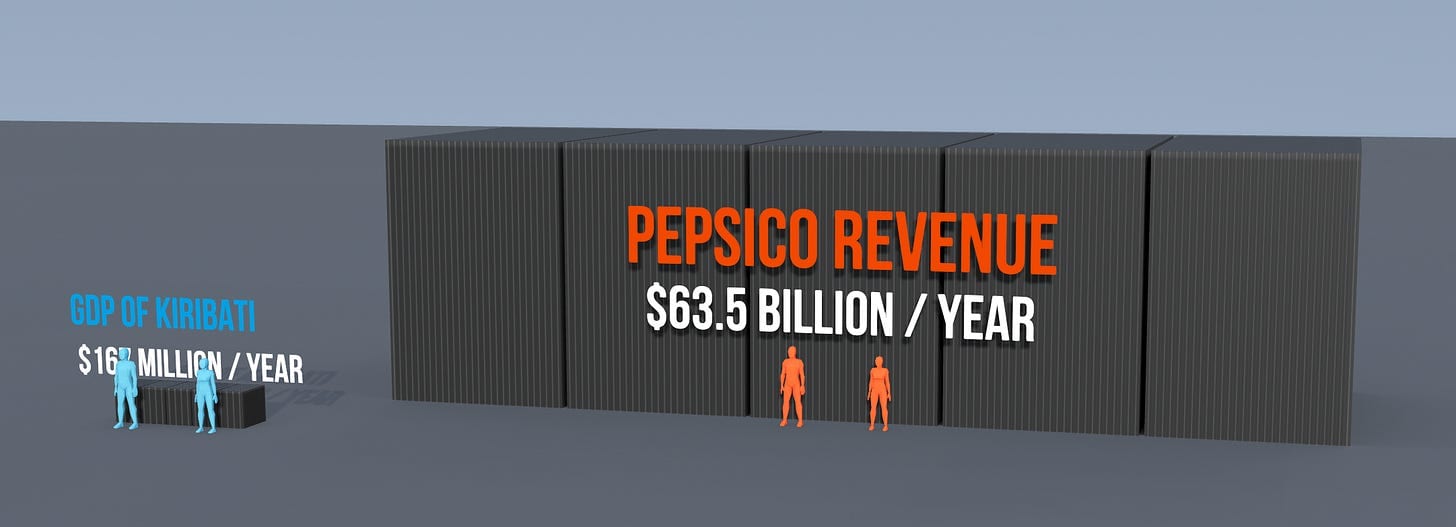
This awesome website generates comparisons of financial values of different companies, countries, products and people: Altered Qualia. Do check this out!
(Be warned, you may end up spending hours messing with it or playing Higher or Lower.)
Income inequality is a great example of a value we may overlook. Many fail to guess their income as a national percentile accurately. We know qualitatively that there is a high degree of income inequality in India - but the exact quantitative nature of this evades us.
Top 1% income earners account for 22.6% of national income (in 2022–23)
To earn the average income in India (INR 234,551 in 2022-23), one would need to be at nearly the 90th percentile of the income distribution. (shows skewness)
By 2022, the top 10% (57.7% share) significantly surpassed the middle 40% (27.3%) share. Which means bottom HALF, which is 700mil people, account for only 15% of the national share.7
Remember, 1% of India is still 1.4 Crore (14 million) people.
The reasons for these circumstances and the solutions to these problems are layered - but it is only if we reach this point of understanding that we can even begin to think of solutions. Often the data collection and analysis of published sources are called into question - but again, we can only dispute it, if we understand it.
On a smaller scale: Here in Bengaluru, we are seldom surprised when we see a news article about poor urban planning. I saw an article announcing the approval of a flyover project, and tried to guess the cost of a flyover project. I was hilariously mistaken. (The Silkboard double-decker flyover cost INR 449Cr. to build.)8
I have a goal to somehow contribute to the development of my city - but I need to first understand the scale on which the city operates, to identify which numbers are bloated and which parts are narrower. The more I am able to dismiss ambiguity, pressure points in problems & their solutions will start becoming apparent to me.
My point is simply this: Only with a firm grasp over the magnitude of things around us can we possibly understand the magnitudes of the underlying issues. To keep our local policymakers accountable, to make debates with our friends more productive, and to come up with better solutions to pressing issues.
Grow your bandwidth
Whether you start this practice to have more fun facts to recite at parties, or to solve national issues, this skill will definitely improve your problem solving ability.
We have infinite data these days, accessible at our fingertips. It is therefore our increasing responsibility to be able to contextualize this data with real world facts, to verify data we are presented with, and to identify trends.
It allows you to be calculatedly skeptical.
It’s like a map of the area you grew up in. As a kid, you would recognize only the roads that directly led to your home. You’d realize where you were about 5 minutes before you got there. Gradually, you began to travel more, learn more and become independent. You then realized what roads connect to where, and suddenly everything made sense. You didn’t sit and memorize the roads, did you? It just came together gradually, as you expanded the breadth of your dataset. This contextualization is what we must aim to do.
MBA ‘caseing’ is the most fun and exciting way to grow this muscle. It gives you good frameworks and ways to come down to these guesses, and helps you reach a good estimate. You have the basic top-down approach & the bottom-up approach.
You can start with a large, known number and start breaking it down into pieces, or start with smaller observable units, and begin scaling them up.
Once you scale, you can start tokenizing. Understanding big values as parts of smaller things. There’s a popular meme about Americans and their use of absurd examples in their counting.

These are exaggerations for comedic value, but I think the concept is helpful in allowing us to understand large values with observable examples as factors.
So, basically:
Read a lot.
Play random guesstimates with your friends, be curious about everything around you.
Play the Price is Right with things you see.
Be skeptical, calculatedly so.
Don’t brush off numbers when they are large or ambiguous, try to relate them as multiples of things you already know.
This is what I am practicing, and I’d be glad if this helps you too. Gradually, the world will start looking like this:
Thanks for reading! Do share surprising examples that you chanced upon too.
References
- IIM Bangalore Carbon Footprint Report 2023-24 ↩
- The Number Sense: How the Mind Creates Mathematics ↩
- PRS India: Union Budget 2024-25 Analysis ↩
- Fiscal Data: Federal Spending ↩
- KFF: What does the federal government spend on health care? ↩
- A320 aircraft pricing reference ↩
- Income & Wealth Inequality in India, 1922-2023: The Rise of the Billionaire Raj ↩
- The Hindu: Bengaluru double-decker flyover cost and traffic impact ↩